PyFWI - An interactive Software for the Simulation of Seismic Waves
PyFWI illustrates the propagation of seismic waves and the concept of seismic imaging. Here we explain the basic ideas behind it. The software is designed for the Open Mathematics Platform Imaginary.
Requirements
PyFWI runs on Linux, OSX and Windows, provided that Python 2.x (we work with 2.7) is installed. In its current state, PyFWI runs best on a Linux desktop. The download package pyfwi.tgz includes a README file describing the installation details.
Download package pyfwi.tgz (about 10 MB)
Software description SeismicWaves.pdf (about 1,6 MB)
Exploration of Planet Earth by Wave Propagation
Recording seismic events is a mayor source of our knowledge about the interior of the earth: from natural seismic sources initiated by earthquakes as well as technically generated sources elastic and acoustic waves propagate through solids and fluids and are measured by geo- and hydrophones. Analyzing many of these signals, the seismograms, allow to reconstruct the wave speed distribution and the location of wave reflections, e.g., at the submarine ground and below. This information characterizes the material distribution of the subsurface.

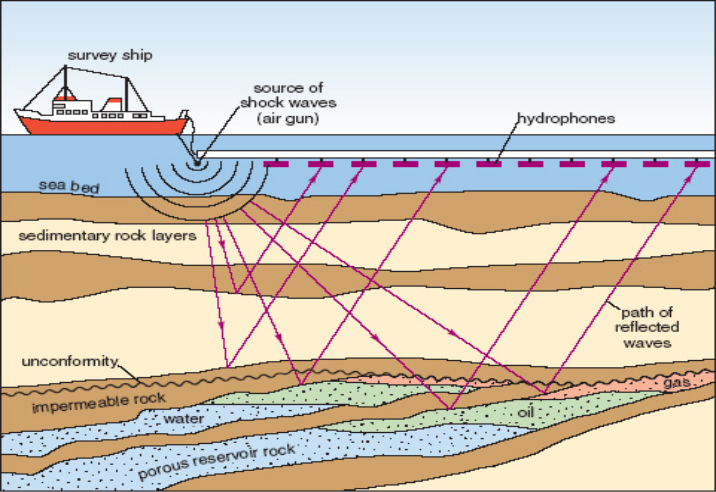
Here we illustrate maritime seismic exploration as it is used by industry, e.g., to find oil reservoirs or to investigate the subsurface prior to the construction of offshore wind parks.
On board of a boat an artificial shock wave is induced which propagates as linear acoustic compression wave through the sea. At the submarine ground it is partially reflected and partially transmitted into the underground; this is repeated at every soil layer interface.
The reflections are recorded at several receivers. The software PyFWI visualizes wave propagation in a simplified configuration and then explains the principle of seismic imaging.
Wave Propagation
In our demonstration the positions of the source (boat) and receiver array can be chosen, and with the drawing tool oil and rock layers can be freely distributed in the soil (we also offer a number of templates).

'Start Simulation' computes the wave propagation and finally displays the seismograms. Playing around with the positions of source and receivers shows that the traces of a second and a third layer may be very weak in the seismograms if most of the wave energy is transmitted or trapped between two layers.
Seismic Imaging
Reliable imaging requires many precise measurements and some a priori information of the soil properties. Here, the principle of seismic imaging is demonstrated as follows.

For numerical tests we may add some uncertainty to the oil and rock layer distribution; then we try to recover the subsurface structure.
'Start Imaging' computes in a number of iterations a correction of the soil distribution so that the simulated seismograms match with the measurements. The correction step is determined by simulating a wave backward from the misfit of the computed and measured seismograms.
The reconstruction is limited to some small observation window due to the extremely small data set; industrial applications use very large receiver arrays and the measurements are repeated several times.
Credits

This interactive software is realized by
- Daniele Corallo
- Johannes Ernesti
- Kevin Ganster
- Christian Rheinbay
- Christian Wieners
on the basis of the open source toolbox PySIT developed by Russell J. Hewett and Laurent Demanet.
We gratefully acknowledge the support of the German Research Foundation (DFG) by CRC 1173 in the subprojects on numerical wave propagation and seismic imaging. The illustrations are provided by our project partner Thomas Bohlen from geophysics.
